Micrograph of Dayton C. Miller Flute 475 Head Joint Interior Looking Through Embouchure, Scale = 500 microns. 2017 (Library of Congress)
model glass studies
Model sample Preparation
determining composition
Target network modifier and network intermediate percentages for each model glass composition, listed in weight oxide percent.
Model glasses compositions representative of Laurent flutes and 19th century photographic glass were made to perform destructive testing after artificial aging. Compositions of model flute glasses were fabricated based on elemental analysis of Laurent Flutes DCM 1235, DCM 717 and DCM 1051 by non-invasive x-ray fluorescence, direct current plasma emission spectroscopy (DCP), and/or scanning electron microscopy with energy dispersive X-ray spectroscopy (SEM/EDS). Photographic model glass compositions were chosen based on analysis of flea market photographic glass and previous work by McCormick-Goodheart.
The model flute glass samples, called Flute-0, Flute-0.25, Flute-0.5, Flute-0.75 and Flute-1, have potassium oxide (K2O) composition between 16.5-20% in 0.5 wt.% intervals. The second group of model glass samples is composed of glass compositions observed in 19th-century photographic glass: soda (Ca5KNa19), soda lime (Ca13KNa13) and potash lime (Ca9K19Na). The compositions of the model glasses are shown in the table to the right.
Quenching of model glass compositions after melting batch recipe.
making the model glass samples
Model glass samples were prepared at the Vitreous State Laboratory at The Catholic University of America (VSL). Glass coupons were prepared by batching 100 grams of each recipe and melting each at 1460ºC (2660ºF) in crucibles made of a platinum/rhodium alloy. The time of melt varied from 120 to 240 minutes depending on the amount of potassium oxide (K2O) flux.
After the bulk glass was prepared, approximately 21 grams of the glass was cast in platinum/gold crucible lids to form smaller sample coins. The coins were melted at 1250ºC (2282ºF) for one hour, then transferred to another furnace to anneal at a temperature based on the glass transition temperature for each sample.
Specimens of model glasses were then powdered and analyzed by x-ray fluorescence at VSL to confirm the target composition. The annealed glass coupons were cut into 5 equal pieces for aging and analysis.
artificial aging of model samples
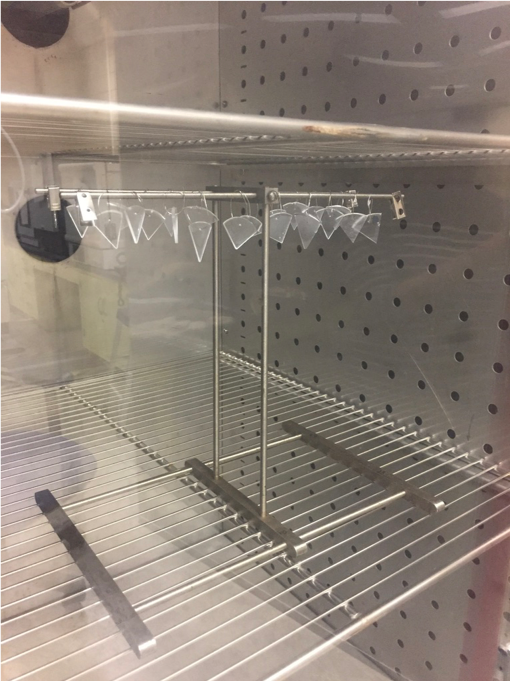
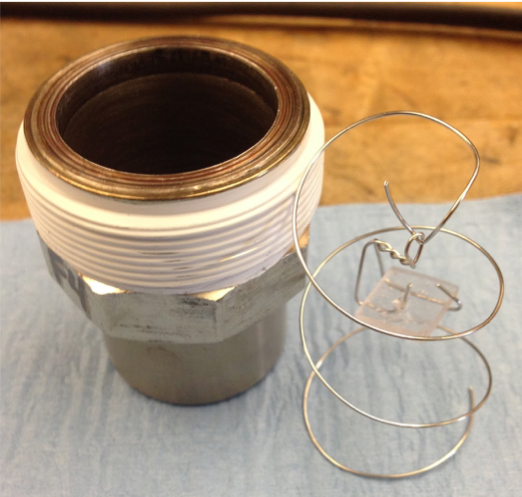
The model glass samples were cut from circular coupons into fourths using a low speed circular saw with a sintered edge diamond blade, then drilled with a 1 mm diameter diamond drill bit. Stainless steel wire hoops were fabricated to mount the sample for one of three aging techniques:
Steady state relative humidity in an environmental chamber at 90°C, 90% relative humidity for up to a week
Dynamic relative humidity cycling in an environmental chamber at 90°C, with 12 hour cycles between 20% and 80% relative humidity up to two weeks
Vapor Hydration Test (VHT) aging at 200°C and 75% relative humidity
These three techniques were all used on model glass samples to see which technique and time aged best replicated the natural aging seen in surveys of the Laurent flutes and the photographic glass surveys.
highlights of findings
Shown above: a-e) Visible photomicrographs of 7-day steady-state humidity aged model flute glasses increasing in K20% from left to right; f-j) SEM cross sections of aged model flute glasses (same composition range as a-e), demonstrating the increase in thickness of the K-depleted alteration layer with increasing wt. % K2O.
Artificially aged model glasses were analyzed by measuring surface pH, visible-light- and UV-induced fluorescence, x-ray diffraction, and scanning electron microscopy/energy dispersive x-ray spectroscopy (SEM-EDS) to track the progressive stages of deterioration as a function of humidity. Our results indicate that the amount of potash correlates directly with observed deterioration in our own model glasses. This is seen in the visible light microscopy images to the left, as the degree of surface cracking at seven days aging in a steady state environmental chamber increases with increasing potash content. Additionally, cross-sectional SEM analyses showed a growing alteration layer increasing in thickness with increased K2O content in the base glass. This coincides with the observation that higher wt. % K2O decreases glass stability
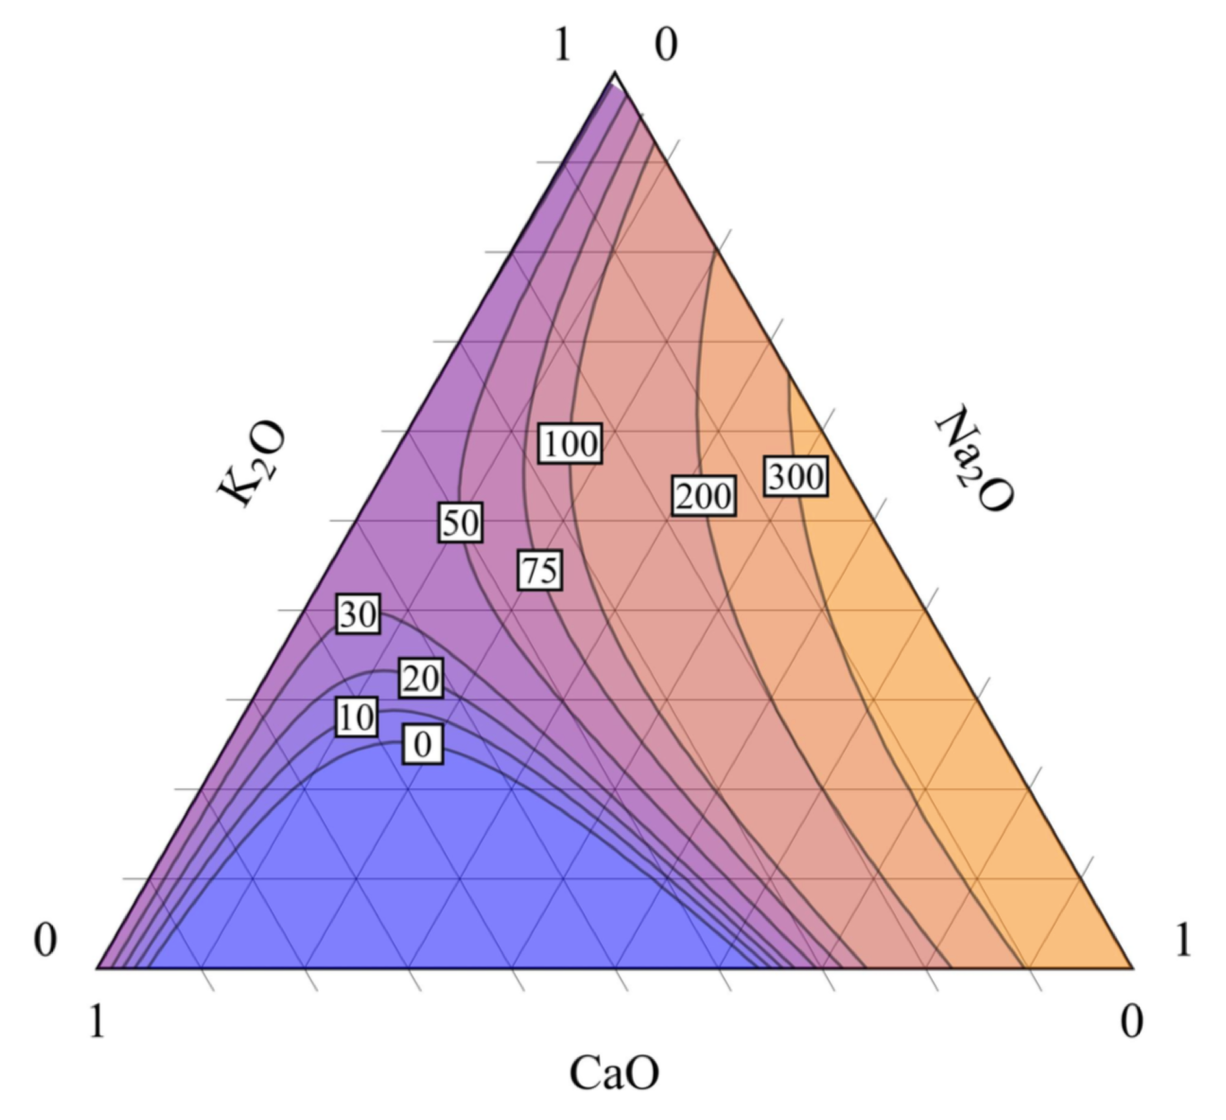
Ternary diagram showing the domain of the combined oxide compositions (~25 mol. %, with SiO2 ~ 75 mol. %) at various predicted alteration depths (μm). The range of oxide compositions is the same as the ternary diagram above.
The alteration depth found by SEM was modeled as a function of glass composition using multilinear regression and partial least squares by researchers at the Vitreous State Laboratory. The analysis yielded a quantitative assessment of dependence of alteration rate and CaO, Na2O and K2O concentration for the model glass composition range studied, which supported the conclusion that having lower CaO and higher K2O and Na2O are more susceptible to larger alteration layers. This information can be useful to conservators if they know the composition of a cultural heritage object. The model could help evaluate the risk to such object thus facilitating selection of proper preservation measures.
The partial least squares method provides a stronger prediction of the glass vulnerability than does the multilinear regression method, although to reduce statistical error, more glasses should be formulated and the number of duplicate tests increased. The ternary figure to the right is a predictive model for alteration layer thickness as a function of composition.
Surface pH measurements of model potash glass coupons on both sides (Note: Flute 0, 0.25, etc… are model glass compositions indicative of Laurent Flute compositions). Measurements in bold font indicate samples that demonstrated visible microcracking.
Surface pH measurement was investigated as a method to detect incipient deterioration, at which deterioration is just starting to develop. pH strips were wet with deionized water and held to the object surface with constant pressure for 2 minutes. As glass deterioration progresses, the presence of surface hydroxide ions increases as alkalis leach to the glass surface and react with atmospheric water. The model flute samples, as seen in the table below, all exhibited alkaline surface behavior. Model flute glass samples with a surface pH of 10 or higher also demonstrated visible microcracking. The relative amount of microcracking and corresponding pH’s were found to be directly correlated, indicating the accelerated alkaline-induced hydration and breakdown of the silicate matrix.
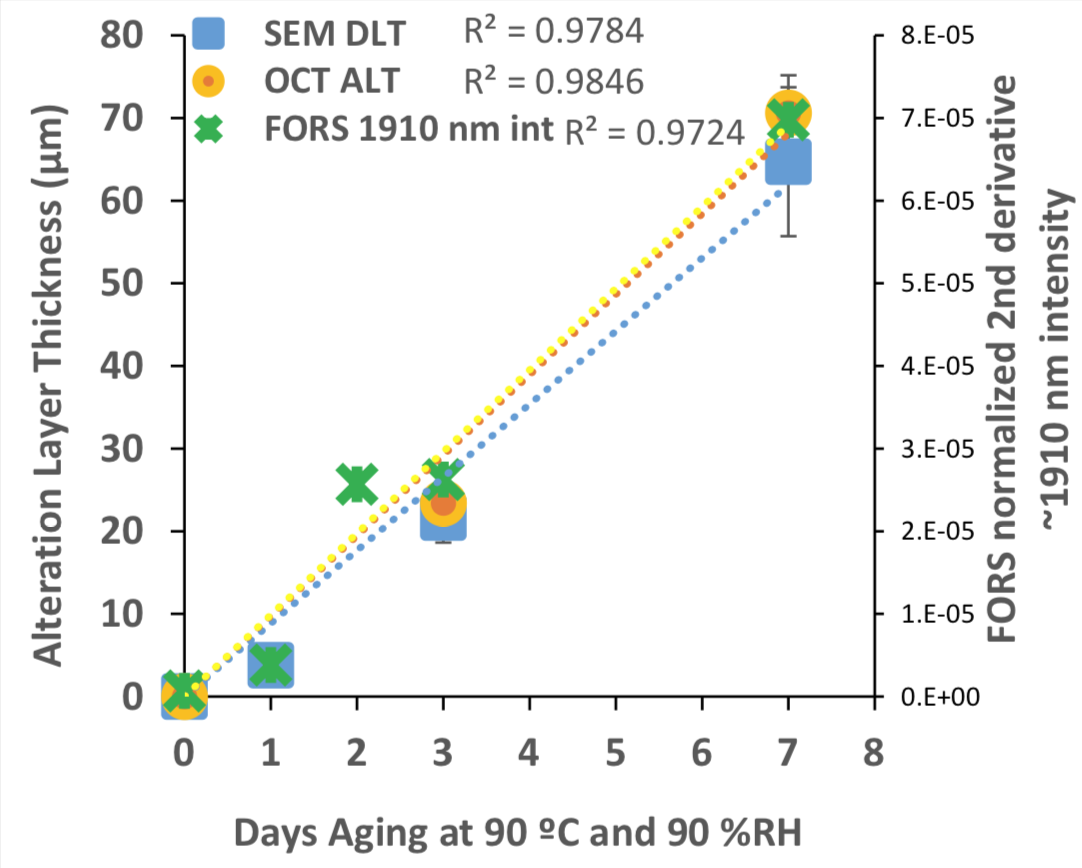
Correlation of data obtained by three methods from model glass sample Flute-1, crucible side, artificially aged at 90 °C and 90 %RH, showing the development over time of aging for: 1) depletion layer thickness (DLT) by BSE-SEM, 2) total alteration layer thickness (ALT) by OCT, and c) normalized 2nd derivative intensity of peak near ~1910 nm in the FORS spectra.
FORS was demonstrated to be a useful tool to provide an early warning for glass degradation. The FORS spectra of all aged samples exhibit increasingly large reflectance features around 1400 and 1900 nm (peaks associated with hydration) with progressive aging. The only model glass that didn’t follow this trend was soda lime model glass. This is in strong agreement with the microscopy results, where visible deterioration is observed in all glass samples but the soda lime model photographic glass. FORS in cultural heritage applications is often more difficult, as objects often have rough and curved surfaces. Our studies showed that FORS is best suited for use in tandem with measurements by instrumental techniques that can determine alteration layer depth, such as SEM or OCT.
OCT scans of model glass samples were conducted at George Washington University as well as the Library of Congress. Two identical systems were used: one at the George Washington University Dept. of Biomedical Engineering, and another loaned to the Library of Congress by ThorLabs. Our results, shown to the right, indicate excellent linear regression coefficients between the SEM and OCT measurements, and a similar trend in FORS measurements.
While BSE-SEM has the advantage of precise measurements, high magnification, and complementary compositional analysis by EDS, the technique poses some significant disadvantages in the cultural heritage arena in terms of destructive sampling, alterations that could occur during sample preparation, and uncertainty regarding whether the microsample is representative. Besides avoiding sampling, OCT has the added benefit of ascertaining differences in condition across an entire object, as well as the advantage of not disturbing the surface under study though contact or mechanical stress. In tandem with FORS, these techniques greatly extend our understanding of the relationship between visible surface features and deterioration phenomena in glass cultural heritage.


